
The Blue Team Perspective
Introduction
You have spent twelve modules learning how to break into systems in the Jr Penetration Tester path. You have scanned networks with nmap, brute-forced credentials with hydra, enumerated web directories with gobuster, and exploited vulnerabilities with Metasploit. Here is a question you probably have not considered: what happens on the other side of the screen the moment your attacks land?
Somewhere, a security analyst's dashboard just lit up. An alert fired. A log entry recorded your source IP, your failed login attempts, your directory brute-force requests. The question is not whether your activity was noticed; it is whether anyone acted on it. Understanding how that analyst works, what tools they rely on, and where their blind spots hide is what separates a competent pentester from an exceptional one.
Why the Blue Team Matters to You
This is not a career pivot. We are not asking you to become a SOC analyst. We are giving you the knowledge to think like one, because pentesters who understand the defender's perspective gain three concrete advantages:
- Stealth: When you know what triggers an alert, you can operate below the detection threshold. A pentester who understands that 50 failed logins from a single IP in under a minute lights up every SIEM in the building will throttle their brute-force attempts or use credential spraying instead.
- Better reporting: Clients do not just want to know what you broke. They want to know whether their defenses caught it and, if not, why. A pentester who can map findings to detection gaps gives clients something actionable.
- Realistic testing: Real adversaries adapt to defenses. If you do not understand those defenses, your testing stays artificial. Purple team engagements, where offense and defense iterate together, produce the deepest security improvements.
Red, Blue, and Purple
Let's put clean labels on these roles. The red team simulates adversaries. Their job is to find weaknesses, exploit them, and demonstrate real-world impact. You have been building red team skills since Module 1.
The blue team defends. They monitor networks, analyze alerts, investigate incidents, and respond to breaches. Their toolkit includes SIEMs, intrusion detection systems, endpoint detection platforms, and forensic tools.
The purple team closes the loop between offense and defense. In a purple team exercise, red executes an attack technique while blue observes in real time. Both sides then iterate: blue tunes their detections, red adjusts their approach, and the cycle repeats. This feedback loop is where organizations see the largest security gains.
Learning Objectives
This room walks you through the defender's world in six stages:
- SOC operations - how a Security Operations Center is structured and why alerts sometimes fall through the cracks
- SIEM fundamentals - hands-on navigation of Splunk, the platform where defenders search and correlate logs
- Log analysis - recognizing attack patterns (the very attacks you have learned to execute) in Windows Event Logs and web server logs
- Incident response - the structured process defenders follow when something goes wrong
- Threat intelligence - frameworks like MITRE ATT&CK and the Pyramid of Pain that give defenders a shared language for adversary behavior
- Capstone investigation - an end-to-end investigation of a real attack scenario using everything covered in the room
By the end, you will be able to look at your own pentesting activity through a defender's eyes and understand exactly what traces you leave behind.
To understand the defender's world, we first need to understand the people and processes inside a Security Operations Center. That is where Task 2 begins.
?Answer the questions below
- Let's see things through the eyes of the Blue Team.
Inside the SOC: How Defenders Operate
In November 2013, Target Corporation's FireEye intrusion detection system flagged malware on its network. The alert fired. A SOC analyst in Bangalore saw it. The system was even configured to auto-delete the threat, but that feature had been turned off. Nobody escalated the alert. For 18 more days, the BlackPOS malware continued scraping credit card data from point-of-sale terminals. By the time the breach was contained, 40 million payment cards had been stolen, 70 million customer records were compromised, and the eventual cost exceeded $162 million. The CEO and CIO both resigned.
Here is what makes this story worth studying: the technology worked. The detection system did exactly what it was supposed to do. The failure was entirely human and procedural. To understand how that kind of failure happens, we need to understand the people, the structure, and the pressures inside a Security Operations Center (SOC).
As we mentioned in the previous task, understanding the defender's world makes you a sharper offensive practitioner. This task introduces the specific people who work that world and the processes they follow every day.
The SOC Tier Structure
A SOC is organized into tiers, each with distinct responsibilities and escalation paths. Consider a hospital emergency department: a triage nurse assesses every patient at the door and decides who needs immediate attention from a specialist. The nurse does not perform surgery, and the surgeon does not sit in the waiting room checking temperatures. Each role exists because the volume of cases demands specialization. In technical terms, SOC tiers work the same way.
L1: Triage Analyst sits at the base. L1 analysts monitor the alert queue, perform initial classification, close false positives, and escalate anything that looks like a genuine incident. They handle the highest volume of work and are the first line of defense. If an alert looks suspicious but requires deeper investigation, the L1 analyst does not attempt to resolve it alone; they escalate upward.
L2: Incident Handler receives escalated alerts from L1. L2 analysts perform deep-dive analysis, scope the incident to determine how many systems are affected, coordinate containment actions, and collect evidence. They have more experience and broader tool access than L1.
L3: Threat Hunter / Senior Analyst operates proactively. Rather than waiting for alerts, L3 analysts form hypotheses about attacker behavior and hunt for signs of compromise that automated detections missed. They also build new detection rules, perform advanced forensics, and develop tools. Some organizations add an L4 tier for SOC management, engineering, and platform maintenance.
The escalation flow is always upward: L1 triages, L2 investigates, L3 hunts and engineers. Each tier filters the workload for the tier above it.
The Analyst Workflow
When an L1 analyst starts a shift, the process follows a consistent pattern:
- Monitor the queue: Open the alert dashboard and review new, unassigned alerts.
- Triage: Select an alert, read its details, and classify it. Is this a known false positive? Does the source IP, event type, or target asset suggest a real threat?
- Investigate: If the alert warrants attention, correlate it with other data sources. Check related logs, look for patterns, and gather context.
- Decide: Either close the alert as a false positive with documentation, or escalate it to L2 with your findings attached.
This cycle repeats dozens or hundreds of times per shift. Speed and accuracy under pressure are what separate an effective L1 from someone who lets critical alerts slip through the cracks.
Measuring SOC Performance: MTTD and MTTR
Two metrics define how well a SOC performs.
Mean Time to Detect (MTTD) measures the average time between an attacker's initial compromise and the organization's detection of the breach. IBM's 2025 Cost of a Data Breach Report puts the global average at 181 days. That means many attackers operate inside networks for over six months before anyone notices. Mandiant's M-Trends 2026 report shows a global median dwell time of 14 days, up from 11 days the year before and 10 days the year before that. The numbers from the two reports differ because they measure different populations: IBM samples breached organizations broadly; Mandiant draws from frontline incident response engagements where the cases tend to involve more sophisticated adversaries. Both directions of travel matter to a pentester. The macro average tells you how long undetected access typically lasts; the rising Mandiant median tells you that targeted, well-resourced attackers are getting better at staying hidden.
Mean Time to Respond (MTTR) measures the average time from detection to containment. IBM's 2025 data reports 60 days. Detecting a breach is only half the problem; containing it before the attacker achieves their objective is the other half.
Lower numbers are better for both metrics. Every additional day of dwell time gives an attacker more opportunity to move laterally, escalate privileges, and exfiltrate data.
Alert Fatigue: The Human Bottleneck
Now we arrive at the reality that explains the Target breach. SOC analysts face a relentless stream of alerts, and the majority of them are noise. Studies indicate that false positive rates in modern SOCs range from 50% to 80%, and only approximately 37% of alerts are actually investigated according to 2026 State of SecOps Report. The rest are either auto-closed, deprioritized, or simply never opened.
This is alert fatigue: the degradation in analyst attention and judgment caused by a constant flood of low-quality alerts. When 7 out of every 10 alerts you investigate turn out to be nothing, you start expecting the next one to be nothing too. Multiply that across an 8-hour shift with hundreds of alerts, and it becomes clear how a real threat can hide in plain sight.
That is exactly what happened at Target. The FireEye system generated a legitimate alert about active malware. But in an environment where analysts were conditioned to see false positives, the alert did not trigger the urgency it deserved. The process broke down not because anyone was incompetent, but because the system's signal-to-noise ratio had eroded analyst trust.
Looking Ahead
SOC analysts need tools to cut through this noise. Monitoring raw log files from dozens of systems, each in a different format, is not scalable. What they need is a centralized platform that collects, normalizes, and correlates data from every source in one place, giving them a single interface to search, investigate, and detect threats. In the next task, we will explore exactly that platform: a Security Information and Event Management system, or SIEM, and we will get hands-on with Splunk for the first time.
?Answer the questions below
- Target's security tools detected the breach in 2013, but the alert was never escalated. What SOC challenge does this failure best illustrate?
- What metric measures the average time between an attacker's initial compromise and the organization's detection of the breach?
Your First SIEM: Navigating Splunk
Picture an L1 analyst arriving for a Monday morning shift. The alert queue is already 200 events deep. Some came from the firewall. Some came from the web server. Some came from Windows endpoints. Each log source has its own format, its own timestamp conventions, its own storage location. Without a single platform to collect, search, and correlate all of those events, the analyst would need to log into a dozen different systems, manually compare timestamps, and hope nothing slips through the cracks. In 2017, that exact problem cost Equifax 147 million consumer records. An expired SSL certificate on a traffic inspection device had gone unrenewed for 19 months, creating a blind spot in encrypted traffic monitoring that attackers exploited during a 77-day breach. The lesson is clear: centralized visibility is not optional; it is the foundation of everything a SOC does.
Building on what we covered in Task 2, where we walked through the SOC tier structure and alert queue workflow, this task introduces the tool those analysts actually use to investigate alerts. That tool is the Security Information and Event Management system, or SIEM.
What a SIEM Does (and What It Does Not)
Consider a restaurant kitchen with orders coming in from the dining room, the bar, the takeaway counter, and a delivery app. If each order goes to a separate notepad in a separate corner of the kitchen, service collapses. A functioning kitchen routes every order to a single screen where the head chef can prioritize, sequence, and track them all. A SIEM is that single screen for a SOC.
In technical terms, a SIEM performs six core functions (we focus on five here; dashboards and reporting belong in more advanced SOC training):
- Aggregation collects logs from endpoints, servers, firewalls, IDS sensors, applications, and cloud services into one platform.
- Normalization converts those diverse log formats into a common schema so that a Windows event and a Linux syslog message can be compared side by side.
- Indexing stores events in a way that enables fast search across millions or billions of records.
- Correlation applies rules that detect patterns across multiple data sources and time windows, like a failed login followed by a successful login followed by sensitive file access.
- Alerting notifies analysts when a correlation rule fires.
What a SIEM does not do is think for you. Without tuned rules, trained analysts, and response procedures, a SIEM is just an expensive log archive. This is Misconception #1 for new analysts: deploying the tool does not equal having security monitoring.
One thing to keep in mind. The Splunk instance in our lab runs Splunk Free, which strips out alerting, role-based access control, and distributed search. In a production SOC running Splunk Enterprise or another commercial SIEM, those features are critical for operational scale. We are working without them here because our focus is on learning to search and analyze data, not on configuring enterprise infrastructure.
The Splunk Data Model
Before we touch the keyboard, we need to understand how Splunk organizes data. Four fields matter most:
index: A logical container for data, similar to a database. Our dataset lives inindex=botsv1.source: The file path or input that generated the event (e.g.,WinEventLog://Security).sourcetype: The classification of the data format. This is the field that tells Splunk how to parse events.WinEventLog:Securityis a sourcetype.suricatais a different sourcetype.access_combinedis yet another. Each has its own field extractions and parsing rules.host: The hostname or IP of the device that generated the event.
Two additional fields appear on every event: _time (the timestamp) and _raw (the original event text before parsing).
Connecting to the Lab
Click Start Lab Machine at the top of this task to launch the Splunk VM. Give it 2-3 minutes to fully boot. Press "Show Split Screen" if not available already.
After login, you land on the Splunk Search & Reporting app. Let's orient ourselves to the interface. Four areas matter:
- Search bar: Where you type SPL (Search Processing Language) queries.
- Time picker: The dropdown to the left of the search bar that controls the time window. This is the single most important control for new users, and we will see why in a moment.
- Fields sidebar: On the left of the results pane, this shows extracted fields you can click to explore values.
- Tabs: Below the search bar, four tabs control how results display: Events (raw log view), Patterns, Statistics (tables from aggregation commands), and Visualization (charts and graphs).
The Time Picker Trap
Here is the moment that trips up every new Splunk user. Type the following query into the search bar and press Enter:
index=botsv1
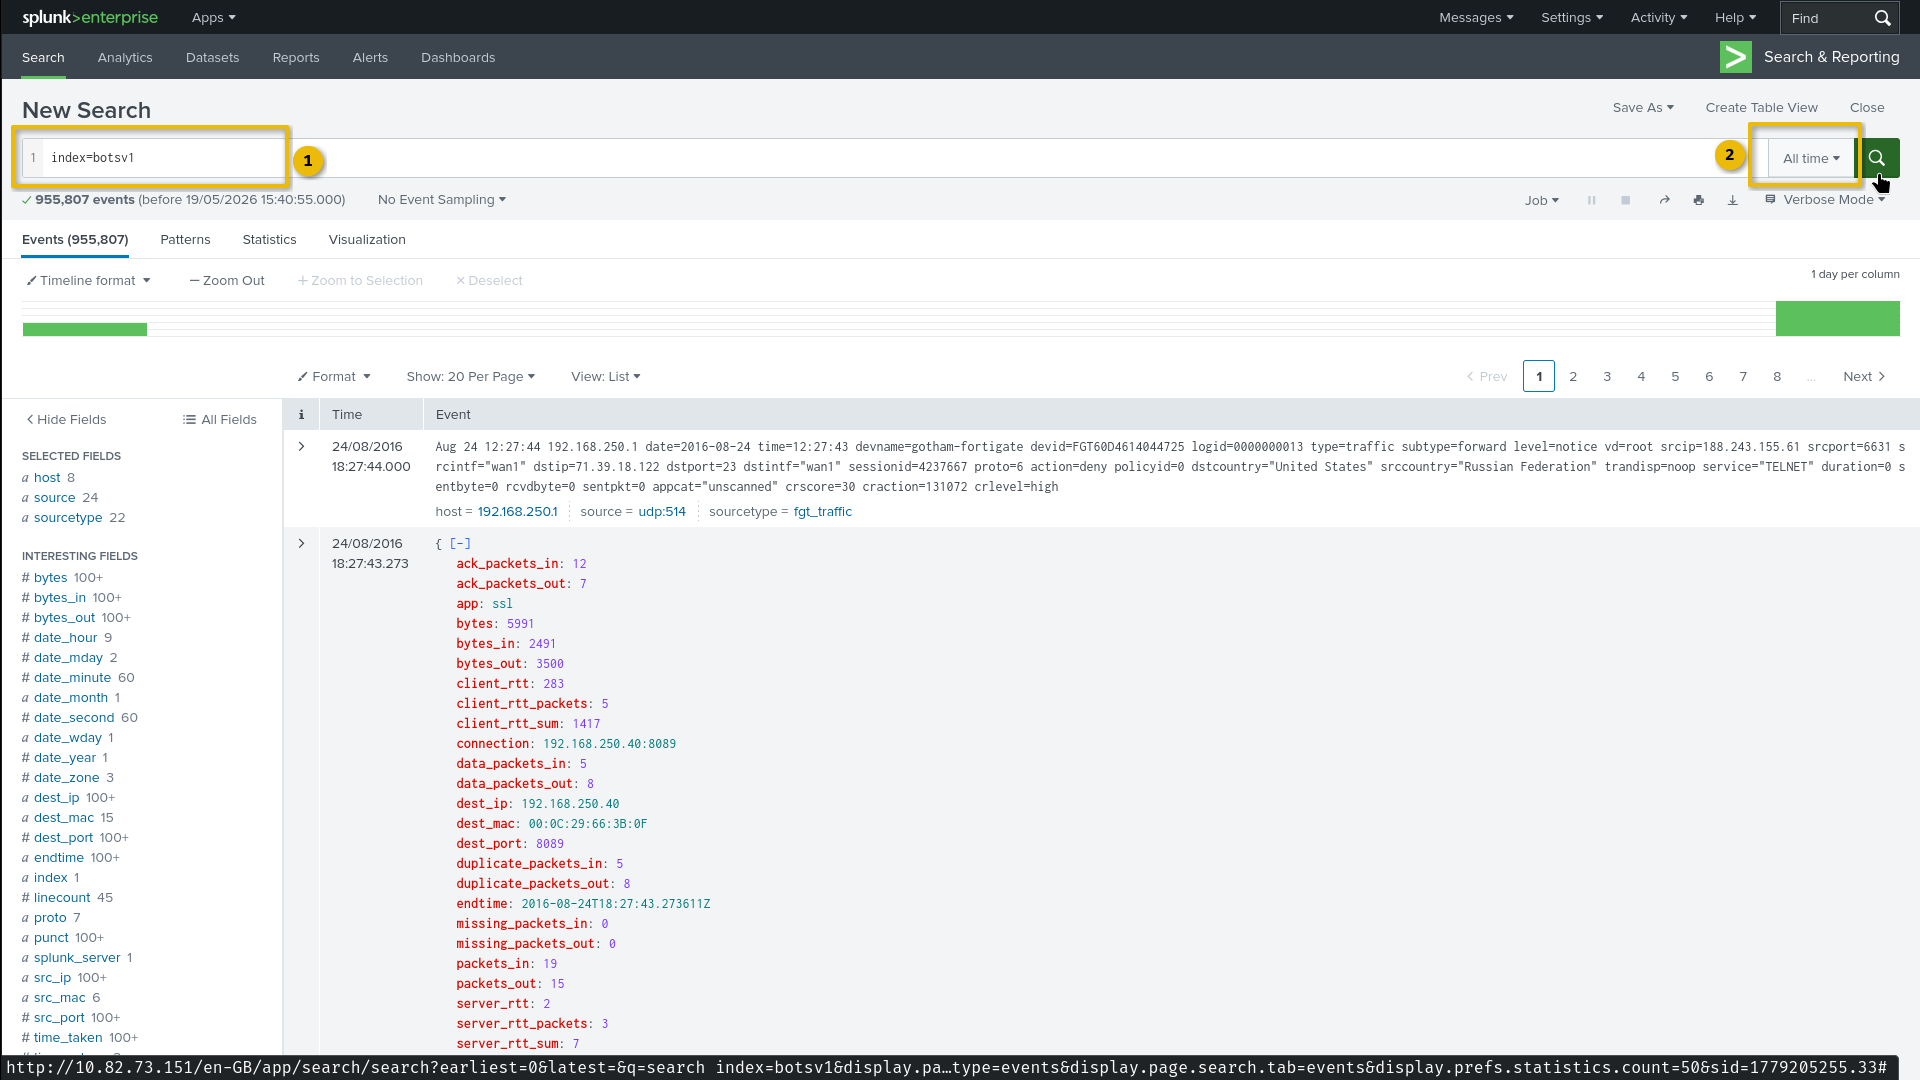
If the time picker is set to its default of Last 24 hours, you get zero results. Nothing. The query is correct, the data exists, but Splunk returns an empty page. The BOTSv1 dataset contains events from August 2016, with the primary attack scenarios concentrated around August 10-11. "Last 24 hours" is looking at today's date, where no events exist. Change the time picker to All time, and suddenly millions of events appear.
This is not a bug. It is how Splunk works in every production environment; the time range always matters. Analysts who forget to set the correct window waste minutes staring at empty screens while an incident clock is ticking.
Core SPL: Searching and Aggregating
SPL works as a pipeline. You start with a search, then pipe (|) the results through transformation commands, each one refining the output. Let's walk through three essential queries.
Query 1: What data do we have?
index=botsv1 | stats count by sourcetype
Click the Statistics tab after running this query. Each row represents a different data format in the BOTSv1 dataset, with its event count. You will see entries like WinEventLog:Security, suricata, access_combined, stream:http, stream:dns, and more. The stats count by sourcetype command groups all events by their sourcetype and counts how many belong to each group.
Query 2: Viewing raw events
index=botsv1 sourcetype=WinEventLog:Security | head 10
The head 10 command limits output to the first 10 events. Switch to the Events tab to see the raw Windows Security log entries. Each event contains fields like EventCode, Account_Name, Source_Network_Address, and the full _raw text.
Query 3: Event volume over time
index=botsv1 sourcetype=WinEventLog:Security | timechart span=1h count
The timechart command creates a time-series aggregation. Switch to the Visualization tab to see a line chart showing how many security events occurred each hour across the dataset window. Spikes in this chart are the first thing an analyst looks for; they indicate something unusual happened during that window.
Note that complex queries across millions of events may take 30-60 seconds to complete. This is normal given the number of events and available resources.
Normal vs. Suspicious: Reading the Timechart
When you look at event volume over time, not every spike is an attack. Knowing what normal looks like is half the job.
| Pattern | Normal | Suspicious |
|---|---|---|
| Security event volume | Steady baseline with slight increases during business hours; small dips overnight | Sharp spikes concentrated in a narrow window, especially outside business hours |
| Failed logon distribution | Scattered across users and IPs; single-digit counts per hour from mistyped passwords | Hundreds of failures from a single IP targeting one account within minutes |
| HTTP 404 volume | Occasional 404s from broken links or user typos; spread over hours | Thousands of 404s from one IP in rapid succession with sequential URI patterns |
| New service installs | Rare; correlated with maintenance windows or software updates | Multiple installs outside change windows with randomized service names |
We will dig into these specific patterns in Task 4. For now, the key takeaway is that a single number means nothing without context. A timechart with 500 events in one hour could be perfectly normal on a busy web server, or it could be a brute-force attack against a quiet endpoint. The analyst's job is to know the baseline.
Methodology Reflection
Let's step back and look at what we just did. We connected to a SIEM, oriented ourselves to the interface, discovered that the time range controls everything, and then used three progressively more complex SPL queries to go from "what data exists" to "show me raw events" to "visualize event patterns over time." This is the fundamental investigative loop in any SIEM: scope the data, narrow the focus, visualize the pattern. The specific platform changes (Splunk, Microsoft Sentinel, Elastic), but the progression from broad to narrow to visual is the same everywhere.
We can now search and aggregate events in Splunk, but knowing how to search is only half the equation. We also need to know what to search for. In the next task, we will learn the specific Windows Event IDs and attack patterns that reveal what attackers are doing, turning raw log data into actionable intelligence.
?Answer the questions below
- What Splunk field classifies the format of ingested data and controls how Splunk parses events?
- Log in to the Splunk VM and access the Search tab. Run: index=botsv1 | stats count by sourcetype . How many distinct sourcetypes appear in the results?
- The BOTSv1 dataset returns zero results when searched with the default Last 24 hours time range. When was the dataset generated? (Answer Format: Month YYYY)
Reading the Logs: Attack Patterns in Event Data
You have run Hydra against a login page and watched passwords scroll by on your terminal. You have fired up Gobuster and watched directory paths get tested one by one. From the attacker's chair, these tools feel surgical and quiet. Now consider what happens on the other end: every failed password generates a log entry, every 404 response gets recorded, and every new service installed leaves a fingerprint in the Windows event log. In May 2017, the WannaCry ransomware worm exploited CVE-2017-0144 (EternalBlue) and tore through 230,000 systems across 150 countries. On every compromised host, the dropper installed its payload as a new Windows service, firing Event ID 7045 in the System log. Defenders who were watching for that single event had an early warning signal. Those who were not watched their networks encrypt. You can read more about it here.
As we mentioned in the previous task, you now know how to search and aggregate events in Splunk. The tool is in your hands. What we need now is a vocabulary of attack signatures: the specific event IDs and log patterns that separate normal operations from active compromise. That is what this task delivers.
The Event IDs That Matter
Windows generates hundreds of event types, but a handful carry outsized detection value. Let's focus on the ones SOC analysts check first.
Authentication Events (sourcetype: WinEventLog:Security):
| Event ID | What It Records | Why It Matters |
|---|---|---|
4624 |
Successful logon | Confirms access. The Logon Type field reveals how: Type 2 (interactive/console), Type 3 (network/SMB), Type 10 (RDP). |
4625 |
Failed logon | Volume and clustering reveal brute-force. A handful per day is normal; hundreds from one IP is not. |
4672 |
Special privileges assigned to new logon | Fires every time an admin account logs on. Expected for IT staff, suspicious for service accounts at odd hours. |
Account Management (sourcetype: WinEventLog:Security):
| Event ID | What It Records | Why It Matters |
|---|---|---|
4720 |
User account created | Persistence via new accounts, especially outside provisioning workflows. |
4732 |
Member added to a local security group | Adding an account to the Administrators group is a classic privilege escalation move. |
Process and Service Events:
| Event ID | Sourcetype | What It Records | Why It Matters |
|---|---|---|---|
4688 |
WinEventLog:Security |
New process created | Tracks what runs on a system. Most useful when command-line auditing is enabled (a Group Policy setting that records the full command line invoked, not just the executable name). |
7045 |
WinEventLog:System |
New service installed | PsExec, malware droppers, and ransomware (WannaCry included) install services. Low volume in stable environments. |
Defense Evasion:
| Event ID | What It Records | Why It Matters |
|---|---|---|
1102 |
Security audit log cleared | High-confidence post-compromise indicator. This event survives the clearing because the clearing action itself generates it before the log is emptied. Near-zero occurrence in healthy environments. [VERIFIED] |
Know Normal to See Abnormal
Spotting attacks requires knowing what legitimate activity looks like first. Consider a building's security desk: if you do not know who works in the building, you cannot spot an intruder. The same principle applies to log data. In technical terms, establishing a behavioral baseline lets you detect deviations that signal compromise.
| Pattern | Normal | Suspicious |
|---|---|---|
Event ID 4625 (failed logons) |
Single-digit to low double-digit per day, scattered across different users and IPs, caused by typos | Hundreds from a single source IP in minutes, targeting one or few accounts, followed by a 4624 from the same IP |
Event ID 4672 (special privileges) |
Fires for known admin accounts on expected machines during business hours | Fires for non-admin accounts, for admin accounts at unusual hours, or on machines they do not normally administer |
Event ID 7045 (new service) |
Sporadic, correlates with documented maintenance windows and software deployments | Outside maintenance windows; randomized service names; executable paths in temp directories or user profile folders |
HTTP 404 responses |
Occasional, scattered across different URIs and client IPs | Hundreds or thousands from a single IP in minutes; sequential alphabetical URI patterns; tool-specific User-Agent strings (scanner tools often send identifiable strings) |
Event ID 1102 (log cleared) |
Extremely rare; occurs during OS reinstalls or documented maintenance only | Any occurrence during an active investigation or outside documented maintenance |
One thing to keep in mind. These baselines are clean and obvious in the BOTSv1 dataset because we are looking at a controlled attack scenario with limited noise. In a production environment with thousands of users, scheduled tasks, and service accounts, the signal-to-noise ratio is far worse. You would need tuned thresholds, allowlists for known service accounts, and time-of-day filters to avoid drowning in false positives. This is worth knowing before you apply this approach outside the lab.
Hunting in the Logs: Three SPL Exercises
Time to put these patterns to work. Your Splunk VM is already running from Task 3. Make sure the time picker is still set to All time.
Exercise 1: Detecting Automated Attack Tools via Network IPS
A flood of network-layer attack signatures from a single IP is one of the clearest brute-force and scanning indicators a defender can detect. The FortiGate UTM's IPS engine logs every blocked or detected attack signature with the source IP. Run this query in the Splunk search bar:
index=botsv1 sourcetype=fgt_utm subtype=ips
| stats count by srcip
| sort -count
| head 1
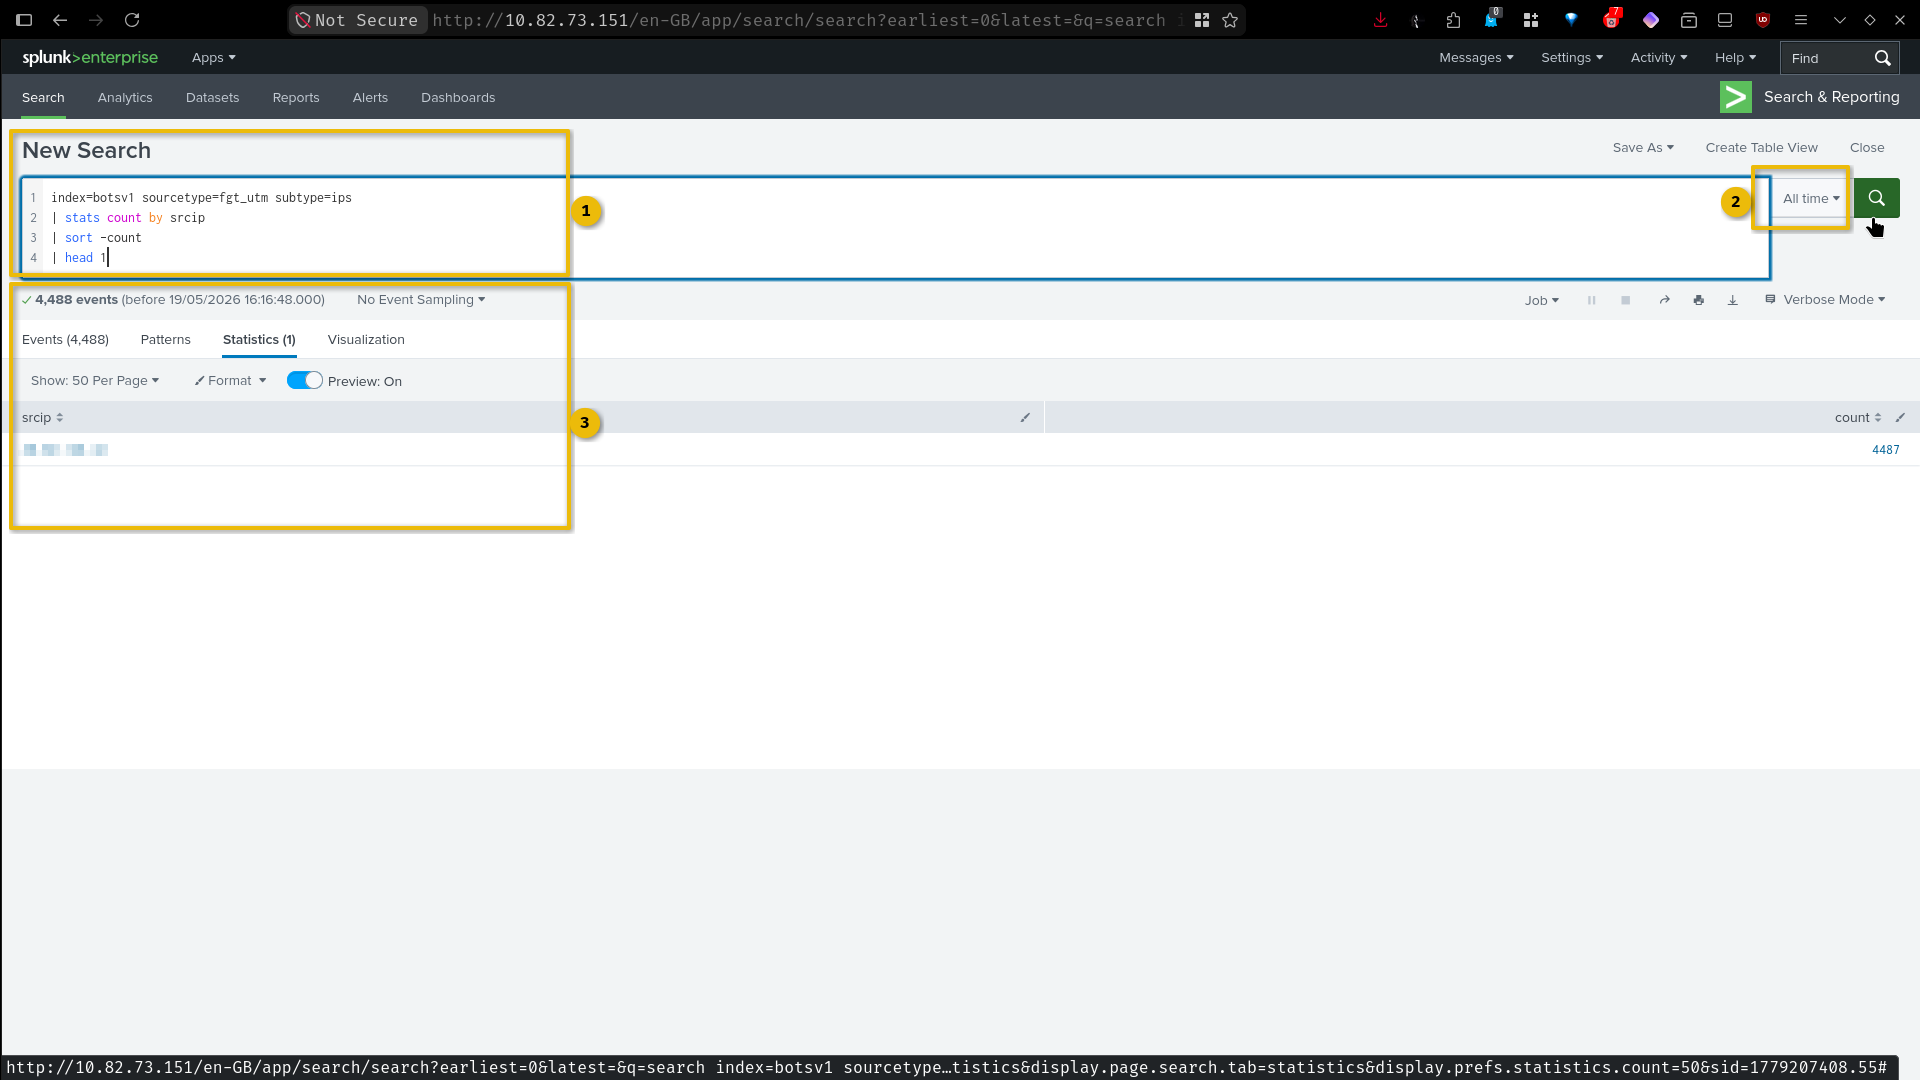
This query counts every IPS-triggered attack event grouped by source IP and returns the top result. Check the Statistics tab. The IP at the top fired thousands of IPS signatures against Wayne Corp's network, the unmistakable signature of an automated scanning or brute-force tool.
A note on sourcetypes and brute-force. In environments where Windows credential brute-force occurs, the equivalent detection uses EventCode=4625 (failed logon) in WinEventLog:Security: index=botsv1 sourcetype=WinEventLog:Security EventCode=4625 | stats count by src_ip | sort -count. The BOTSv1 attack against Wayne Corp focused on web application exploitation rather than Windows credential attacks, so this dataset demonstrates brute-force detection at the network layer. The detection logic is identical: aggregate by source, count, and look for outliers.
Exercise 2: Detecting Web Directory Brute-Forcing
When Gobuster or a similar tool runs against a web server, it generates a flood of requests to nonexistent paths. The server responds with HTTP 404 for each one. Wayne Corp runs IIS, so we query the iis sourcetype, which uses W3C log format field names: c_ip for client IP and sc_status for the server response code. Run:
index=botsv1 sourcetype=iis sc_status=404
| stats count by c_ip
| where count > 100
| sort -count
The IP at the top of the results hammered the web server with requests for paths that do not exist. That volume of 404s from a single source is not someone clicking broken links; it is automated enumeration.
Exercise 3: Spotting New Service Installations
The WannaCry dropper installed itself as a Windows service. PsExec does the same thing during lateral movement. Let's look for service installations in the BOTSv1 data:
index=botsv1 sourcetype=WinEventLog:System EventCode=7045
| table _time, Service_Name, Service_File_Name
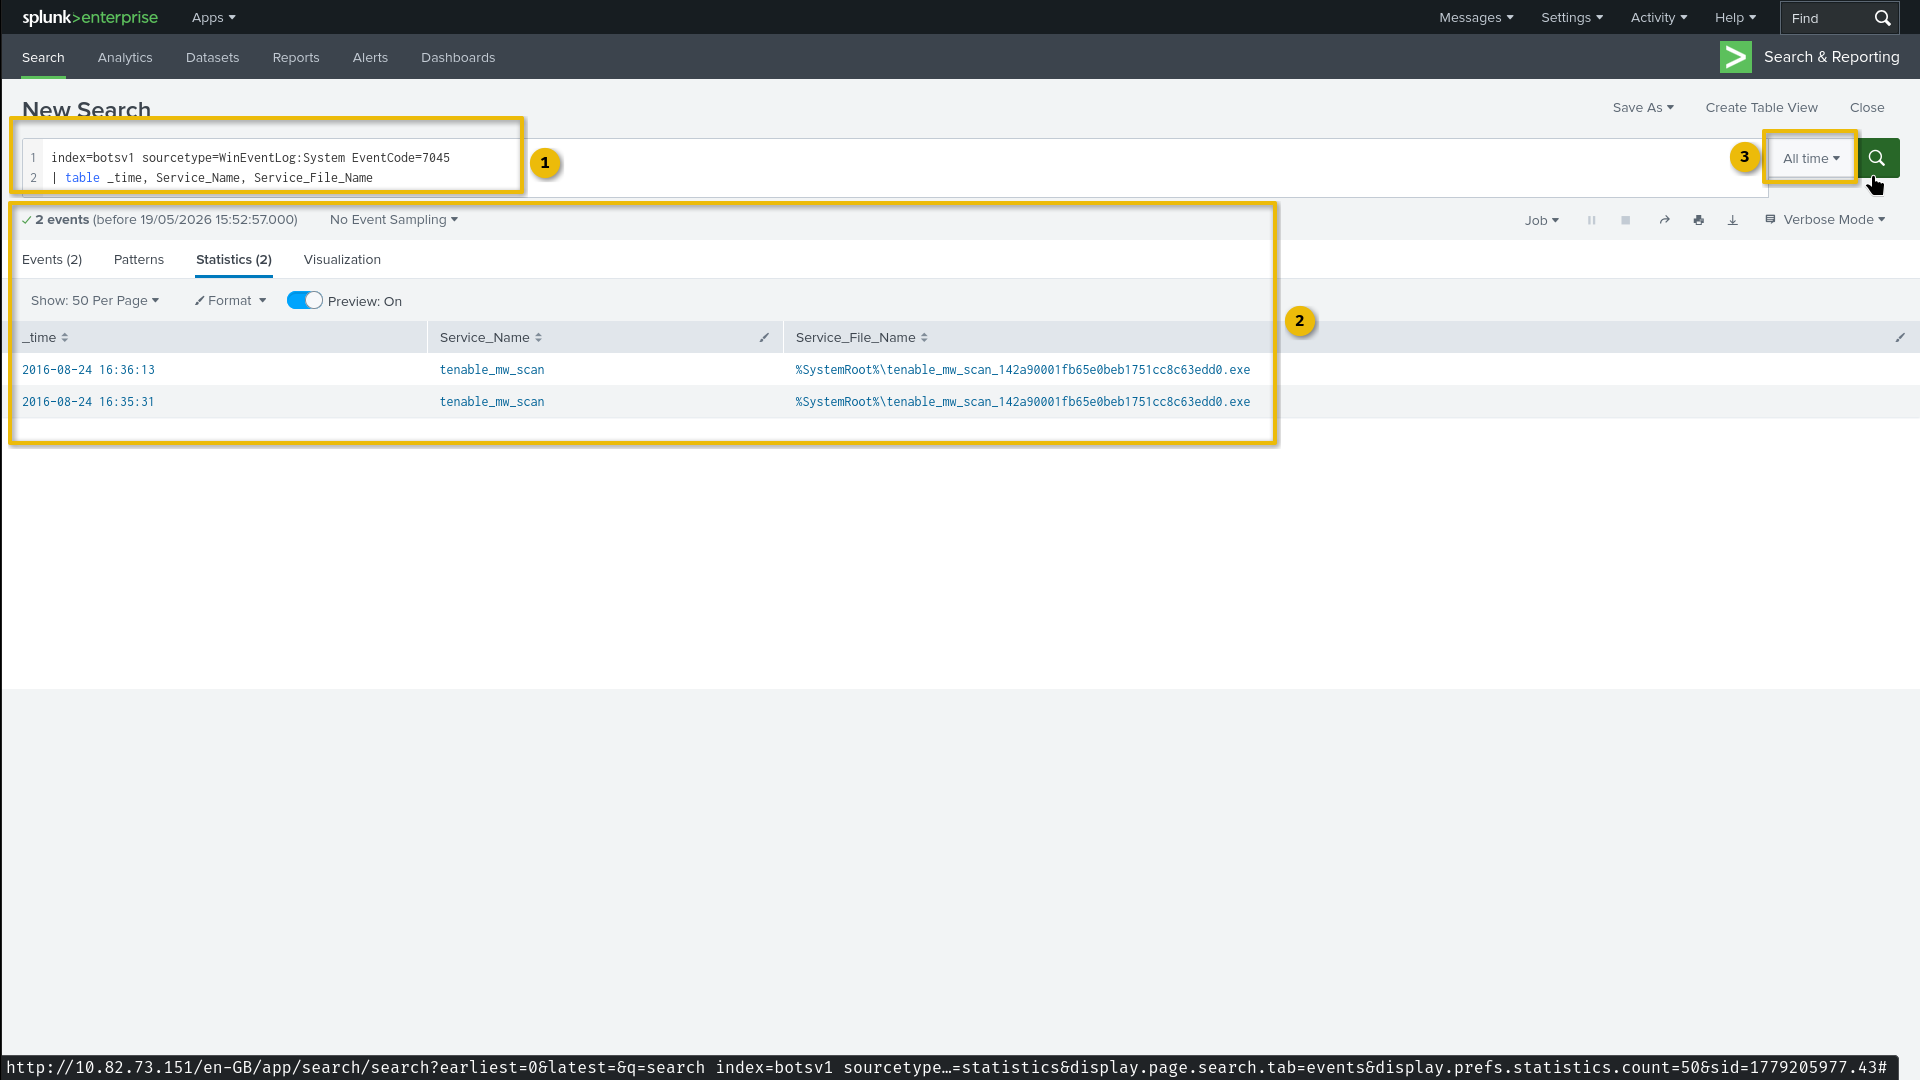
Review the results. Pay attention to the Service_File_Name column. Services with executable paths pointing to temporary directories, user profile folders, or randomized names deserve closer scrutiny. In the BOTSv1 dataset, you will see tenable_mw_scan installed from %SystemRoot% with a long randomized hash in the filename — that is the Nessus vulnerability scanner, which installs a Windows service during a remote scan. Even a legitimate tool looks suspicious on this output: an unusual service name, a hash-like filename, two installations within a minute of each other. A real analyst would need to correlate this against the change management record to confirm it is authorized. In a production environment, you would cross-reference these against your change management system to verify whether each installation was authorized.
Connecting the Dots
Let's step back and look at the pattern across these three exercises. We started with authentication logs to find brute-force activity, moved to web access logs to detect enumeration, and checked system logs for persistence via service installation. Each query targeted a different log source and a different phase of an attack, yet the detection logic was the same every time: aggregate by source, count, and look for outliers. This pattern, counting events from a single source and flagging volumes that exceed a baseline, is the foundation of threshold-based detection. The specific Event ID and sourcetype change depending on what you are hunting, but the analytical approach transfers directly.
We can now detect individual attack indicators across authentication logs, web access logs, and system logs. But real incidents do not consist of a single indicator; they chain together across phases: reconnaissance, then initial access, then persistence, then lateral movement. In the next task, we will explore the incident response lifecycle that structures how defenders manage the full scope of an incident from first detection through recovery.
?Answer the questions below
- Run the IPS detection query above. What is the source IP with the highest count of IPS-triggered attack signatures? (Answer Format: X.X.X.X)
- Using the web enumeration query above, what is the IP address generating more than 100 HTTP 404 responses? (Answer Format: X.X.X.X)
When Things Go Wrong: The Incident Response Lifecycle
You have detected the attack. The brute-force attempts are lighting up the dashboard, the web directory enumeration is obvious, and a suspicious service just appeared on a critical server. Now what? The difference between a contained incident and a catastrophic breach often comes down to what happens in the next 60 minutes. Does the analyst escalate? Does the team know who to call? Is there a playbook, or is everyone improvising?
In the previous task, we learned to detect individual attack patterns in log data. Each pattern was a signal, a single piece of evidence that something was wrong. But a real incident is not a single signal; it is a cascade of events that demands a coordinated, structured response. Knowing how to spot a brute-force is valuable. Knowing what to do after you spot it is what separates a functional security team from one that watches a breach unfold in slow motion. That structured response is the incident response lifecycle.
The NIST SP 800-61 Rev 2 Lifecycle
The most widely adopted framework for incident response comes from NIST Special Publication 800-61 Revision 2, published in 2012. It defines four phases that form a cycle, not a straight line:
- Preparation: Build the capability before anything goes wrong. Write policies, deploy monitoring tools, train analysts, establish communication plans, define escalation procedures. A team that skips this phase is improvising during a crisis.
- Detection and Analysis: Identify that an incident has occurred, then determine its scope and severity. This is where SIEM alerts, log analysis, and triage happen. The skills we practiced in Task 4, spotting brute-force patterns, flagging log clearing events, recognizing service installations, all live in this phase.
- Containment, Eradication, and Recovery: Stop the bleeding, remove the threat, and restore operations. Short-term containment isolates affected systems. Eradication removes the attacker's foothold. Recovery brings systems back online with monitoring to confirm the threat is gone.
- Post-Incident Activity: Learn from what happened. Conduct a lessons-learned meeting, document the timeline, identify what worked and what failed, and feed improvements back into the Preparation phase.
The critical insight is that arrow from Post-Incident Activity back to Preparation. Every incident teaches the team something. Maybe the playbook was missing a step. Maybe log retention was too short to reconstruct the full attack timeline. Maybe the escalation path was unclear. Those lessons become preparation improvements for the next incident. The lifecycle is cyclical because incidents never stop coming, and each one should make the team stronger.
NIST SP 800-61 Rev 2 also establishes three key definitions worth knowing:
- Event: Any observable occurrence in a system or network
- Adverse event: An event with a negative consequence
- Computer security incident: A violation or imminent threat of violation of computer security policies, acceptable use policies, or standard security practices
Not every event is adverse, and not every adverse event is an incident. Part of Detection and Analysis is making that determination.
In April 2025, NIST published SP 800-61 Rev 3, which retains all three concepts but updates them: "event" now explicitly includes cloud and virtual platforms; "adverse event" is broadened to non-cyber causes; and "computer security incident" is renamed "cyber security incident" with a CIA-triad-forward definition drawn from FISMA 2014. Rev 2 remains the most widely taught model due to its conceptual clarity, and it is the version we focus on here.
The SANS PICERL Model
You will encounter a second framework in the field: the SANS PICERL model. It breaks the response into six phases:
| SANS Phase | Maps to NIST Rev 2 Phase |
|---|---|
| Preparation | Preparation |
| Identification | Detection and Analysis |
| Containment | Containment, Eradication, and Recovery |
| Eradication | Containment, Eradication, and Recovery |
| Recovery | Containment, Eradication, and Recovery |
| Lessons Learned | Post-Incident Activity |
The key difference is granularity: SANS treats containment, eradication, and recovery as distinct operational phases rather than grouping them under a single label. In practice, containment, eradication, and recovery are distinct activities with different goals and different people involved. SANS makes that explicit. Neither model is "better"; they describe the same process at different levels of granularity. Many organizations use NIST for policy documentation and SANS for operational playbooks.

Case Study: When Frameworks Fail
Frameworks only work when humans follow them. Let's look at two breaches where specific phases broke down.
Target, 2013. FireEye, Target's malware detection platform, identified the BlackPOS malware and generated an alert on November 30, 2013. The Detection phase worked. The tool did its job. But the Bangalore SOC team that received the alert did not effectively escalate it to the Minneapolis security team. The Analysis and escalation portion of Detection and Analysis failed. Eighteen days passed between the first alert and containment. The result: 40 million payment card records stolen, $162 million in breach costs, and the resignation of both the CEO and CIO. As we discussed in Task 2, alert fatigue played a role here, but the deeper failure was procedural. There was no enforced escalation path that ensured a critical alert could not be silently dropped.
SolarWinds SUNBURST, 2020. APT29 inserted a backdoor into the SolarWinds Orion build pipeline. The trojanized update was distributed to approximately 18,000 organizations. The backdoor remained active for roughly nine months before FireEye detected it in December 2020. Nine months. That is a Detection and Analysis failure measured not in days but in seasons. The MTTD metric we covered in Task 2 captures exactly this problem: when the time between compromise and detection stretches to months, the attacker has effectively unlimited freedom to move laterally, exfiltrate data, and establish persistence. The SolarWinds case also demonstrates why log retention matters. If an organization only retains logs for 90 days, they cannot reconstruct what happened during a nine-month intrusion. The Post-Incident Activity phase for SolarWinds-affected organizations drove widespread changes to Preparation: improved supply chain verification, longer log retention policies, and behavioral detection capabilities that look for anomalous patterns rather than matching known indicators.
Grounding the Framework: Detection and Analysis in Action
Frameworks can feel abstract until you connect them to real artifacts. Let's ground the Detection and Analysis phase with a concrete example from the BOTSv1 dataset. In Task 4, we listed Event ID 1102 (Security audit log cleared) as a high-confidence indicator of post-compromise cleanup. Now, run that query and see what it looks like in practice.
In the Splunk search bar, run:
index=botsv1 sourcetype=WinEventLog:Security EventCode=1102
If results appear, each event represents a moment where someone cleared the Windows Security Event Log. This is exactly the kind of artifact a Detection and Analysis team must not miss. An attacker who clears logs is actively trying to remove evidence, which tells you two things: they have already compromised the system, and they know enough to cover their tracks. That single event changes the severity classification of the entire incident.
One thing to keep in mind. In the BOTSv1 dataset, log clearing events may be limited or absent because it is a curated CTF scenario, not a production environment. In a real enterprise, Event ID 1102 is rare enough that any occurrence outside documented maintenance should trigger immediate investigation and escalation.
The pattern we just followed, detecting individual indicators, classifying them within the IR lifecycle, and using them to determine scope and severity, is the core of what happens during the Detection and Analysis phase. The tools change between organizations, but the process remains the same: identify signals, assess context, escalate appropriately.
We have now covered the framework that tells defenders how to manage an incident from first detection through recovery and lessons learned. But managing the response is only half the problem. To truly understand what an attacker is doing, defenders need a structured knowledge base of adversary techniques, a common language that maps attacker behavior to known patterns. In the next task, we will explore exactly that: the MITRE ATT&CK framework.
?Answer the questions below
- In the NIST SP 800-61 Rev 2 lifecycle, which phase occurs before any incident is detected and focuses on building capability through policies, tools, and training?
- The SolarWinds SUNBURST backdoor remained undetected for approximately 9 months. Which phase of the NIST SP 800-61 Rev 2 IR lifecycle failed during this time?
Know Your Enemy: Threat Intelligence Basics
Over the past few tasks, we have built serious capability. We can navigate a SIEM, detect brute-force attacks, spot web directory enumeration, identify service installations, and structure our response using the NIST IR lifecycle. But consider this scenario: you finish a pentest engagement and now you need to hand off your findings to the client's security team, a threat intelligence platform, or a partner organization in another country. How do you describe what the attacker did in a way that every defender on the planet understands?
You need a common language for adversary behavior. As we mentioned in the previous task, the IR lifecycle tells us how to manage an incident. This task gives us the vocabulary to describe what the adversary actually did, and a framework for deciding which indicators are worth blocking.
MITRE ATT&CK: A Shared Dictionary for Adversary Behavior
You learned the Cyber Kill Chain earlier in the path. It gives you seven linear phases of an attack, from reconnaissance to actions on objectives. It is a solid mental model, but it has limits. Real attacks are not linear; attackers loop back, skip stages, and operate across multiple objectives simultaneously. The Cyber Kill Chain also does not map specific attacker behaviors to the groups that use them.
The MITRE ATT&CK (Adversarial Tactics, Techniques, and Common Knowledge) framework solves these problems. Think of ATT&CK as a dictionary for adversary behavior. Just as a dictionary organizes words by definition and usage, ATT&CK organizes attacker actions by why they do something (the goal), what they do (the method), and how specifically they do it (the implementation). In technical terms, this means the framework is structured into three levels:
- Tactics (14 in the Enterprise matrix): The adversary's goal. Each tactic answers the question "why is the attacker doing this?" For example, the tactic Credential Access (TA0006) means the attacker's goal is to steal account credentials.
- Techniques: The method the adversary uses to achieve a tactical goal. Under Credential Access, one technique is Brute-Force (T1110), the method of trying many passwords to guess the right one.
- Sub-techniques: A more specific implementation of a technique. Under Brute-Force, sub-technique T1110.001 is Password Guessing, where the attacker targets a specific account with many password attempts.
Below sub-techniques are procedures, the documented real-world implementations by specific threat groups or malware. APT29 using the SUNBURST backdoor to communicate over DNS to avsvmcloud.com is a documented procedure under T1071.004 (Application Layer Protocol: DNS). Procedures ground the abstract framework in observed reality.
Unlike the Kill Chain's seven linear steps, ATT&CK's 14 tactics are non-linear. An attacker might achieve Persistence before Privilege Escalation, or return to Discovery multiple times throughout an operation. The framework is also continuously updated as researchers document new adversary behavior, which makes it a living knowledge base rather than a static model.
The Pyramid of Pain: Not All Indicators Are Equal
Detecting an attacker is one thing. Making them hurt is another. David Bianco's Pyramid of Pain (2013) ranks six types of indicators by how much operational difficulty they cause an attacker when a defender detects and blocks them.
Picture a pyramid with six layers. The base is wide and easy to stand on; the peak is narrow and painful to balance on. Each layer represents an indicator type:
| Layer | Indicator Type | Pain Level | BOTSv1 Example |
|---|---|---|---|
| 6 (top) | TTPs | Tough | Brute-force behavior (T1110) |
| 5 | Tools | Challenging | Specific exploit framework used by po1s0n1vy |
| 4 | Network/Host Artifacts | Annoying | URI patterns from directory enumeration |
| 3 | Domain Names | Simple | C2 domain |
| 2 | IP Addresses | Easy | Attacker source IP |
| 1 (bottom) | Hash Values | Trivial | MD5 of a malware binary |
The logic is straightforward. If you block a malware hash, the attacker recompiles the binary with a single-byte change, producing a completely new hash in seconds. If you block an IP address, they spin up a new cloud server in minutes. But if you detect and block the behavior pattern itself, the attacker must fundamentally redesign their operation. That is real pain.
Consider this with SolarWinds SUNBURST (2020). The attack mapped to multiple ATT&CK techniques: T1195.002 (Supply Chain Compromise), T1071.004 (DNS-based C2), and T1036.005 (Masquerading). When defenders blocked the C2 domain avsvmcloud.com, that was a layer 3 action (Simple). APT29 could register a new domain. But if defenders detect the behavior of software update mechanisms making encoded DNS queries to unknown domains, that targets the TTP layer, and the attacker must redesign their entire C2 infrastructure.
Mapping BOTSv1 to ATT&CK
Let's ground this framework in the attacks we have already detected. Every pattern from our earlier queries maps to a specific ATT&CK technique:
| Attack Pattern | ATT&CK Technique | ID |
|---|---|---|
| Brute-force login attempts | Brute-Force: Password Guessing | T1110.001 |
| Port and service scanning | Network Service Discovery | T1046 |
| Web directory enumeration | Active Scanning: Wordlist Scanning | T1595.003 |
| Lateral movement via SMB | Remote Services: SMB/Windows Admin Shares | T1021.002 |
| Audit log clearing | Indicator Removal: Clear Windows Event Logs | T1070.001 |
Now let's surface a pattern we have not examined yet. In your Splunk instance, run the following query to look at process creation events:
index=botsv1 sourcetype=WinEventLog:Security EventCode=4688 | table _time, New_Process_Name, Creator_Process_Name | head 20
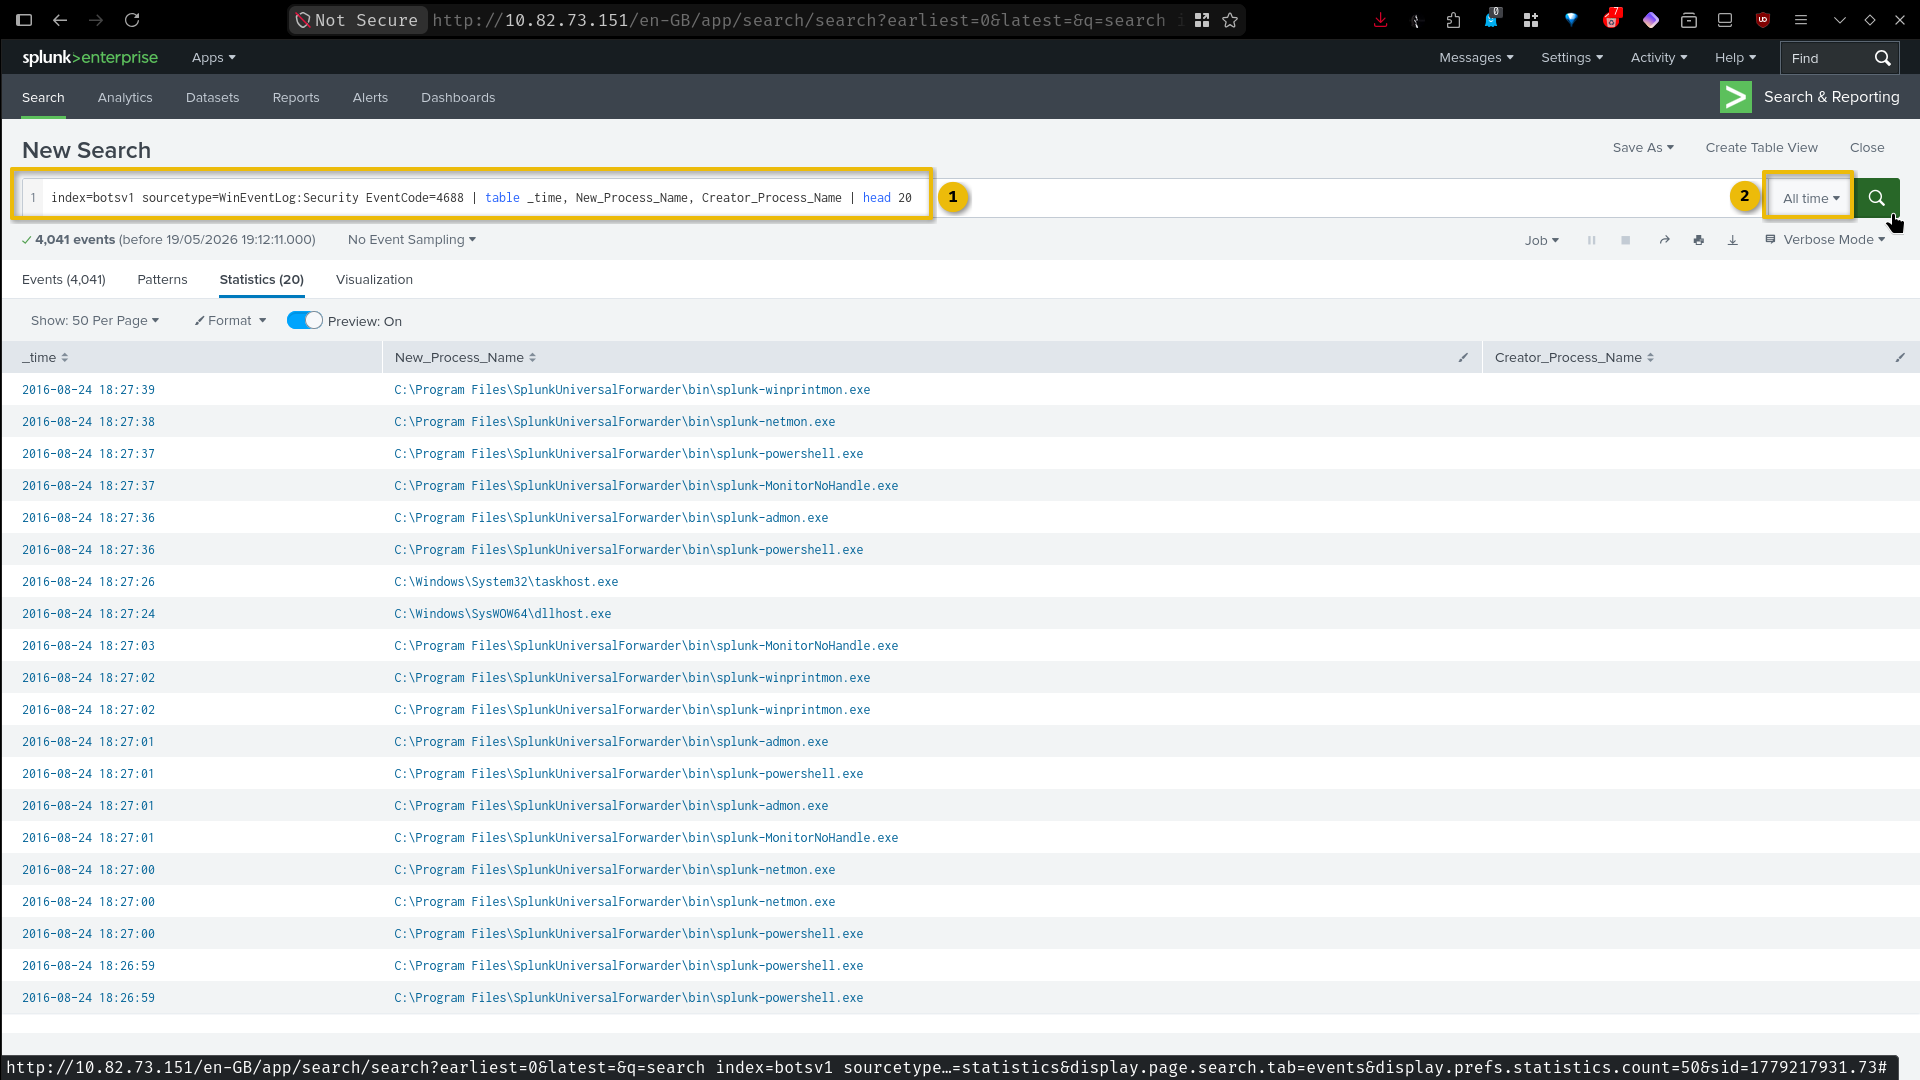
This query searches Event ID 4688 (new process creation) and displays the process that was launched alongside the process that launched it. Look at the results. You should see entries where cmd.exe or powershell.exe is spawned by a parent process that would not normally invoke a command interpreter, such as a web server process or a service binary. When an attacker gains access to a system and needs to execute commands, they almost always reach for cmd.exe or powershell.exe. This behavior maps to ATT&CK technique T1059 (Command and Scripting Interpreter).
One thing to keep in mind. In this lab environment, the BOTSv1 dataset contains a manageable number of process creation events, making unusual parent-child relationships easy to spot. In a production environment with hundreds of endpoints and thousands of legitimate processes spawning command interpreters during software deployment and system administration, you would need to establish a baseline of normal parent-child process relationships and alert only on deviations. This is worth knowing before you apply this approach outside the lab.
The ATT&CK Navigator
MITRE provides a free web-based tool called the ATT&CK Navigator at https://mitre-attack.github.io/attack-navigator/. It renders the full Enterprise matrix as an interactive grid where you can color-code techniques to visualize which ones your organization can detect, which ones a specific threat group uses, or which ones appeared in a particular incident. No installation is required. If you want to explore it, open the Navigator in your browser (on your own machine, not the VM) and look at how the 14 tactic columns are populated with techniques.
Reflection
Let's step back. We started this task by identifying a gap: the need for a common language. We filled it with ATT&CK's hierarchical structure (tactics, techniques, sub-techniques, procedures) and then layered on the Pyramid of Pain to evaluate which indicators actually matter. The transferable pattern here is prioritization by adversary cost. Whether you are writing detection rules, allocating SOC resources, or planning a purple team engagement, the question "how much does this hurt the attacker?" should guide your decisions. Blocking a hash is free and nearly useless; detecting a TTP is harder to build but forces the adversary to fundamentally retool.
We now have all the building blocks: SOC workflow, SIEM skills, event ID knowledge, the IR lifecycle, and threat intelligence frameworks. In the next task, we will combine everything into a complete investigation of the Wayne Corp attack, working through the full chain from initial alert to ATT&CK mapping.
?Answer the questions below
- In the MITRE ATT&CK framework, tactics represent the adversary's goal (the "why"), and techniques represent the method (the "what"). What is the third level of specificity below techniques?
- On the Pyramid of Pain, which layer represents the indicator type that causes the most operational difficulty for an attacker when defenders detect and block it?
- In the BOTSv1 dataset, you queried Event ID 4688 (new process creation) and observed cmd.exe and powershell.exe being spawned by unusual parent processes. Which ATT&CK technique covers adversaries executing commands through scripting interpreters like cmd.exe and PowerShell? (Answer Format: TXXXX)
Putting It All Together: The Wayne Corp Investigation
It is 8:47 AM on your first day in Wayne Corp's SOC. You are still learning where the coffee machine is when a Suricata alert fires: unusual traffic volume hitting the web server. Your L2 analyst called in sick. The queue is yours. You need to triage this alert, figure out who is behind it, trace what they did, and decide what happens next. Every skill we have built across this room, SPL queries, Event ID interpretation, the IR lifecycle, ATT&CK mapping, converges here.
This is not a drill. Let's work it.
Step 1: Triage the Alert
The alert says "unusual traffic." That is vague. Our first job is to narrow it down to a specific source. As we covered in Task 3, Splunk lets us aggregate and sort across millions of events in seconds. We start where the alert originated: the suricata sourcetype.
Run the following query in Splunk:
index=botsv1 sourcetype=suricata NOT src_ip=192.168.* NOT src_ip=10.*
| stats count by src_ip
| sort -count
| head 1
This counts every Suricata IDS alert grouped by source IP, filtering out RFC1918 private ranges to focus on external attackers. The IP at the top of the list is an external host generating more IDS alerts against Wayne Corp than any other source. That is our primary suspect.
Why filter private IPs? In this dataset, internal hosts generate a large volume of Suricata alerts because traffic between network segments is also inspected. Filtering for external IPs surfaces the attacker who initiated the compromise from outside the network. In a real investigation you would also examine the top internal IP, as it could indicate a compromised internal host being used as a pivot.
Record that IP address. Every query from this point forward pivots on it.
Step 2: Pivot to Web Access Logs
Knowing the attacker's IP, we now check what they were doing on the web server. We pivot from suricata to iis, Wayne Corp's IIS web server access logs. IIS uses W3C log format, so the client IP field is c_ip, the request method is cs_method, and the URI path is cs_uri_stem. Specifically, we want to know which URI paths received the most POST requests from our suspect, because POST requests carry data to the server and are commonly used for form submissions, file uploads, and exploitation payloads.
Replace <attacker_ip> with the IP you found in Step 1:
index=botsv1 sourcetype=iis c_ip=<attacker_ip> cs_method=POST
| stats count by cs_uri_stem
| sort -count
| head 1
The URI at the top of the results is the endpoint the attacker hammered the hardest. This tells us the attack target: the specific page or script they were exploiting.
Step 3: Confirm Reconnaissance
Before exploitation, attackers typically perform reconnaissance. In Task 4, we learned that web directory brute forcing produces a distinctive signature: a flood of HTTP 404 (Not Found) responses from a single source. Let's check whether our attacker followed this pattern:
index=botsv1 sourcetype=iis c_ip=<attacker_ip> sc_status=404
| stats count
If the count is in the hundreds or thousands, the attacker ran a wordlist scanner against Wayne Corp's web server before attempting exploitation. This maps to ATT&CK technique T1595.003 (Active Scanning: Wordlist Scanning) under the Reconnaissance tactic, exactly what we covered in Task 4.
Step 4: Check Windows Event Logs for Post-Exploitation
An attacker who finds a way in rarely stops at the web server. We need to check whether the compromise extended into the Windows environment. Using the attacker IP as a free-text search term, we search authentication events:
index=botsv1 sourcetype=WinEventLog:Security (EventCode=4624 OR EventCode=4625) <attacker_ip> | stats count by EventCode
Searching for the IP as a bare token matches it anywhere in the raw event, which is the most reliable approach across Windows Event Log parsing configurations. Event ID 4625 entries from the attacker IP indicate failed login attempts against Windows hosts. Event ID 4624 entries indicate successful logins. If both appear, the attacker moved from the web server into Windows authentication, expanding the scope of the incident.
Expected result for this dataset. The Wayne Corp attack focused on web application exploitation rather than direct Windows credential attacks from the external IP. The Windows Security logs may return zero results for the external attacker IP we identified earlier. This is informative in itself: it tells you the attacker's compromise was contained to the web application layer in the available log data — they did not directly authenticate against Windows hosts from their external IP. In a real investigation, a zero result here would lead you to check whether the web server was used as a pivot point to reach internal Windows systems.
Reconstructing the Attack Chain
Pulling our findings together, the po1s0n1vy attack against Wayne Corp followed a recognizable chain:
- Reconnaissance (T1595.003): Wordlist scanning against the web server produced over 2,000
404responses — confirmed via FortiGate IPS and IIS logs - Initial exploitation: Over 14,000 concentrated
POSTrequests to/joomla/index.php/component/search/indicate active exploitation of the Joomla CMS — likely SQL injection - Impact (T1491.002): The sustained
POSTactivity against specific Joomla endpoints is consistent with web defacement, Wayne Corp's publicly stated incident
Each finding came from a different sourcetype. Suricata gave us the attacker. FortiGate IPS confirmed the scanning volume. IIS web logs revealed the exploitation target and request volume. No single log source told the full story.
One thing to keep in mind. Cross-sourcetype correlation works cleanly here because all data sources are pre-collected in one Splunk index. In a production environment with distributed infrastructure, log forwarding delays, and incomplete coverage, you would need to account for time skew between sources and verify that every relevant log source is actually being collected. This is worth knowing before you apply this approach outside the lab.
Mapping to the IR Lifecycle
Where does this leave us in the NIST SP 800-61 Rev 2 lifecycle we studied in Task 5? We just completed the Detection and Analysis phase: we triaged the alert, identified the attacker, scoped the incident across multiple data sources, and reconstructed the attack chain. The next phase is Containment, Eradication, and Recovery, where the team would isolate the compromised web server, remove the attacker's access, and restore the defaced site from a known-good backup.
Methodology Reflection
Let's step back and look at the pattern. We started with a single alert from one data source (Suricata), extracted an indicator (the attacker IP), and used it as a pivot to query progressively deeper data sources: web logs for application-layer activity, then Windows Event Logs for host-level compromise. At each step, the previous finding shaped the next query. This workflow, alert triage to indicator extraction to cross-source pivoting to timeline reconstruction, is the core investigative loop for any SOC analyst regardless of the SIEM platform or the attack type. The specific queries change; the pattern stays the same.
This investigation used every skill from the room: SPL queries from Task 3, Event ID interpretation from Task 4, the IR lifecycle from Task 5, and ATT&CK mapping from Task 6. In the next task, we will step back and connect everything we have learned to the bigger picture of how blue team knowledge strengthens your work as a penetration tester.
?Answer the questions below
- Run the Suricata external-attacker query above. What is the primary external attacker IP address? (Answer Format: X.X.X.X)
- Using the attacker IP you identified, search the IIS web access logs for the URI path that received the most POST requests. What is the URI? (Answer Format: /path/to/resource)
Conclusion
Now that you have sat on both sides of the screen, how does this change how you approach your next pentest?
That is not a rhetorical question. Over the previous seven tasks, we went from understanding how a SOC operates, to navigating a SIEM, to reading attack patterns in logs, to structuring incident response, to mapping adversary behavior with ATT&CK, to running a full investigation against Wayne Corp. As we mentioned in Task 7, the capstone investigation combined every skill in the room into a single workflow. Now we connect it back to why you are here: you are training to be a penetration tester, and everything you just learned makes you a better one.
Three Ways Blue Team Knowledge Improves Your Pentesting
Stealth. You now know what triggers alerts. Hundreds of EventCode=4625 events from one IP in two minutes light up every SOC dashboard in the building. A slow, distributed credential test spread across hours against multiple accounts looks like normal authentication noise. Pentesters who understand detection thresholds design engagements that test real defenses rather than tripping the first alarm and getting caught in the lobby.
Reporting. You have seen what an L1 analyst does with a finding: they triage it, check surrounding context, and escalate with evidence. Pentesters who understand this workflow write findings that defenders can actually act on. Instead of "SQL injection found on login page," you write the finding with the sourcetype where the evidence appears, the Event IDs the SOC should monitor, and the ATT&CK technique ID for consistent classification. Your report becomes an input the blue team can use, not a document they have to translate.
Scoping. You now understand that every incident triggers the full IR lifecycle: detection, analysis, containment, eradication, recovery, post-incident review. That is weeks of work for a security team. Pentesters who grasp this overhead scope engagements realistically, setting rules of engagement that test defenses without creating months of cleanup for the client.
The Purple Team Feedback Loop
Throughout this room, we kept returning to the idea that red and blue are not separate disciplines. They are two halves of the same feedback loop. The attacker executes a technique; the defender detects it (or does not); both sides iterate. This is the essence of purple teaming, and it is one of the most valuable career paths in security. Professionals who can operate on both sides of that loop, who can build a detection and then bypass it, are consistently the hardest to hire and the most impactful on any team.
Consider this a career model, not just a skillset. Every pentest you run from this point forward is an opportunity to note which of your actions would have been caught and which slipped through. That observation, recorded and shared, is purple teaming in practice.
What Comes Next in the Learning Path
This room covered reactive defense: monitoring alerts, triaging incidents, responding after something has already happened. The next room in Module 13, DevSecOps 101, shifts the focus to proactive security. Instead of waiting for an attack and then responding, DevSecOps integrates security testing into the development pipeline itself, catching vulnerabilities before they reach production. It is the difference between a fire department that responds to fires and a building code that prevents them.
Here is how the skills stack together:
| Room | Focus | When security happens |
|---|---|---|
| The Blue Team Perspective (this room) | SOC operations, SIEM, IR lifecycle, threat intel | After deployment, in response to attacks |
| DevSecOps 101 (next room) | Security in CI/CD, automated testing, shift-left | During development, before deployment |
Both approaches are necessary. Neither replaces the other. A strong security program needs defenders who can respond to incidents and processes that prevent the incidents from occurring in the first place.
This room gave you the defender's perspective: the people, the tools, the frameworks, and the investigative workflow that sit on the other side of every pentest you will ever run. Carry that perspective forward. In the next room, we will explore how security integrates directly into the software development lifecycle with DevSecOps.
?Answer the questions below
- Follow through the attached static site to test your knowledge. What is the flag you get after going through all the steps?
 LLM Pentesting
 DevSecOps Basics